Created At
Jan 08, 2022
Created By SmartHomeEddy
Get the current and forecast measurements for your location on Air Quality (CO, NO, NO2, O3, SO2, NH3, PM2...
Created At
Jan 08, 2022
Last Update
Jul 23, 2024
Platforms
HC 3 Lite, Z-box Hub, Yubii Home Pro, Yubii Home, Venture WISE, HC 3
Views
6329
Download
223
The QuickApp Air Quality OpenWeatherMap provides the current and forecast measurements for your location on Air Quality.
Besides basic Air Quality Index the QuickApp provides also data about polluting gases such as Carbon monoxide (CO), Nitrogen monoxide (NO), Nitrogen dioxide (NO2), Ozone (O3), Sulphur dioxide (SO2), Ammonia (NH3), and particulates (PM2.5 and PM10).
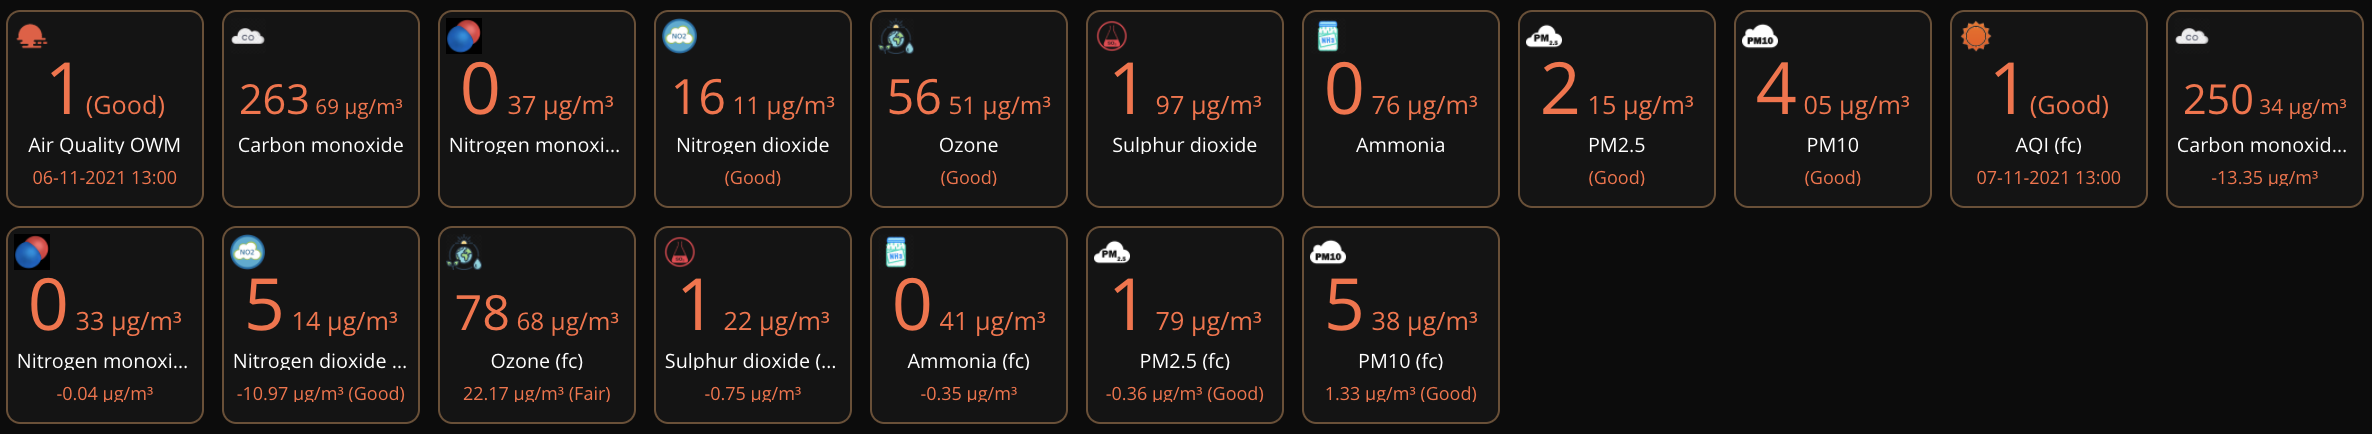
This QuickApp has Child Devices for Carbon monoxide (CO), Nitrogen monoxide (NO), Nitrogen dioxide (NO2), Ozone (O3), Sulphur dioxide (SO2), Ammonia (NH3), PM2.5 and PM10 for current measurement.
This QuickApp has also Child Devices for Air Quality Index, Carbon monoxide (CO), Nitrogen monoxide (NO), Nitrogen dioxide (NO2), Ozone (O3), Sulphur dioxide (SO2), Ammonia (NH3), PM2.5 and PM10 for forecast measurement.
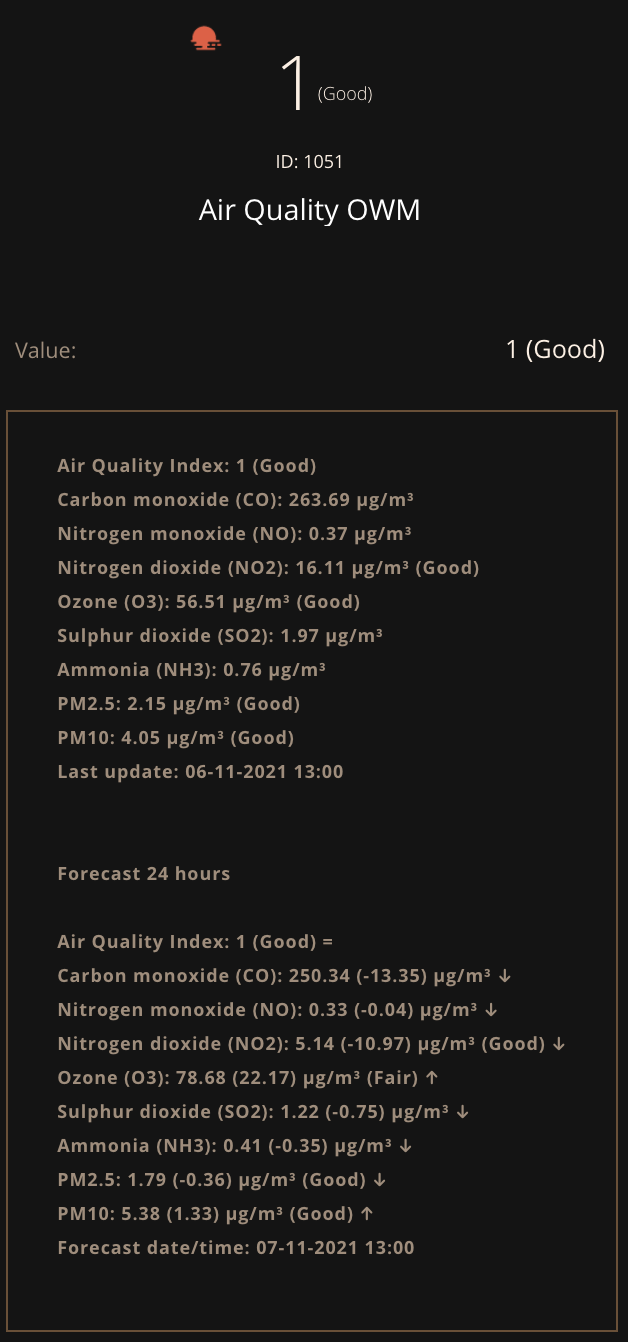
This QuickApp has Child Devices for Carbon monoxide (CO), Nitrogen monoxide (NO), Nitrogen dioxide (NO2), Ozone (O3), Sulphur dioxide (SO2), Ammonia (NH3), PM2.5 and PM10.
Common Air Quality Index (CAQI)
The Common Air Quality Index (CAQI) is an air quality index used in Europe since 2006. In November 2017, the European Environment Agency announced the European Air Quality Index (EAQI) and started encouraging its use on websites and for other ways of informing the public about air quality.
As of 2012, the EU-supported project CiteairII argued that the CAQI had been evaluated on a "large set" of data, and described the CAQI's motivation and definition. CiteairII stated that having an air quality index that would be easy to present to the general public was a major motivation, leaving aside the more complex question of a health-based index, which would require, for example, effects of combined levels of different pollutants. The main aim of the CAQI was to have an index that would encourage wide comparison across the EU, without replacing local indices. CiteairII stated that the "main goal of the CAQI is not to warn people for possible adverse health effects of poor air quality but to attract their attention to urban air pollution and its main source (traffic) and help them decrease their exposure."
The CAQI is a number on a scale from 1 to 100, where a low value means good air quality and a high value means bad air quality. The index is defined in both hourly and daily versions, and separately near roads (a "roadside" or "traffic" index) or away from roads (a "background" index). As of 2012, the CAQI had two mandatory components for the roadside index, NO2 and PM10, and three mandatory components for the background index, NO2, PM10 and O3. It also included optional pollutants PM2.5, CO and SO2. A "sub-index" is calculated for each of the mandatory (and optional if available) components. The CAQI is defined as the sub-index that represents the worst quality among those components.
Here is a description of Air Quality index levels Pollutant concentration in μg/m3:
Index NO2 PM10 O3 PM25 (optional)
Good 1 0-50 0-25 0-60 0-15
Fair 2 50-100 25-50 60-120 15-30
Moderate 3 100-200 50-90 120-180 30-55
Poor 4 200-400 90-180 180-240 55-110
Very Poor 5 >400 >180 >240 >110
See more on CAQI: https://en.wikipedia.org/wiki/Air_quality_index
Version 2.0 (21th July 2024)
IMPORTANT
Variables (mandatory):

How to install:

A new version is available which handle empty and partly empty responses better
For this QuickApp you (only) need an API key from https://home.openweathermap.org/users/sign_up

ok, let's move to the Fibaro forum (yep, the link is working well with my API string, as I wrote in my message, the "both services" are those you have in your manual - openweather and agrominitoring)
Hi Artur, Thanks for using the quickapp. "both services", I think you also run an other quickapp with OpenWeatherMap for weather data. You can indeed use the same account. Let first try if your API key is working. If you use this link in your browser, you can check if you get an answer. Change the apikey at the end of the url with your key from your account. http://api.openweathermap.org/data/2.5/air_pollution?lat=50&lon=50&appid=apikey You should see something like: {"coord":{"lon":51.1266,"lat":16.9656},"list":[{"main":{"aqi":4},"components":{"co":206.95,"no":0.02,"no2":0.07,"o3":107.29,"so2":1.01,"pm2_5":21,"pm10":56.05,"nh3":0},"dt":1645095600}]} This Marketplace is a bit difficult to message, could you use the Fibaro forum? If the above url works, we should look at some loggings.
A new version is available! - Solved an bug when OpenWeatherMap gave an empty result - Change code to multifile